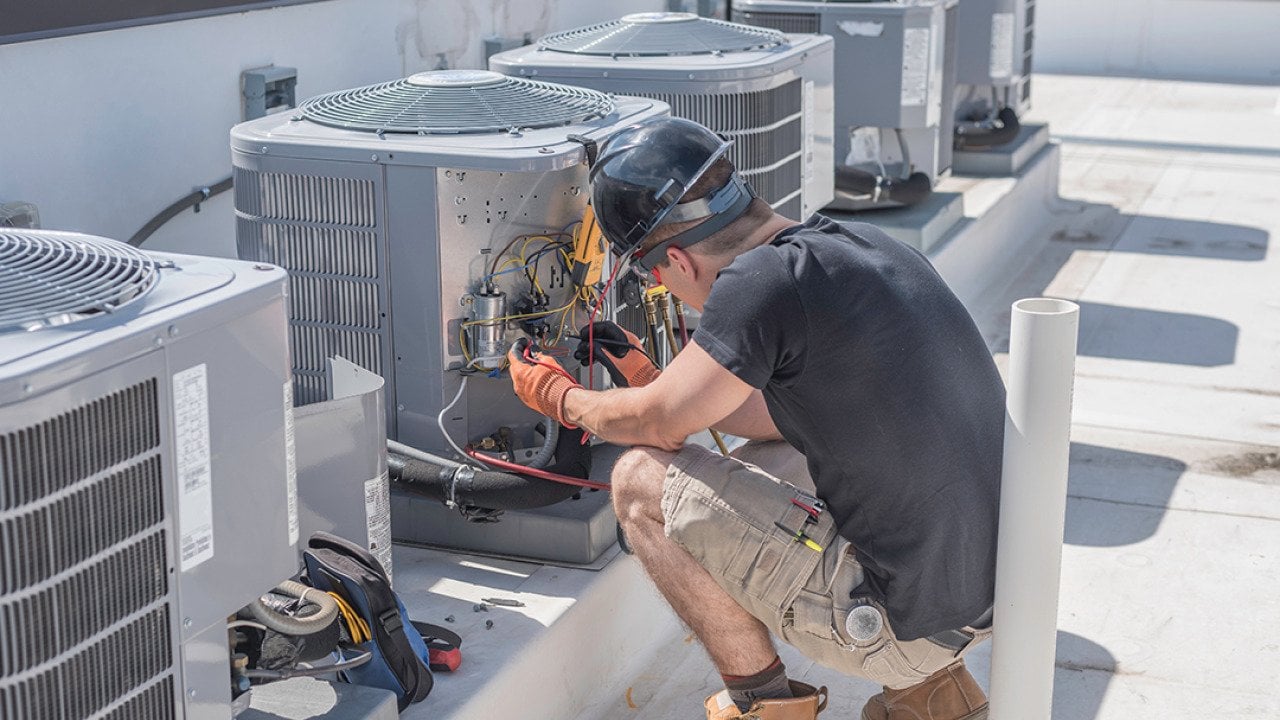
David Spates // Shutterstock
If you wait until summer to think about your HVAC system, you’re already late.
New data analyzing more than 65 million HVAC service visits across the U.S. shows that February is consistently the slowest month of the year for HVAC technicians—making it the easiest, least stressful time for homeowners to schedule service.
By March, demand starts rising. By summer, HVAC crews are stretched thin. And later in the year, service backlogs intensify as systems work harder.
If you want to avoid long wait times and last-minute breakdowns, February is your window. In this article, Samsara examines national HVAC service patterns and what they mean for homeowners.
February Is the National Low Point for HVAC Demand
HVAC service demand follows a predictable annual cycle. The point that matters most for homeowners is when that cycle bottoms out—because lower technician workload means more appointment flexibility and fewer delays.
Across the U.S., February sits at or near the lowest level across every operational measure.
Average US HVAC Activity by Month (Per Vehicle)
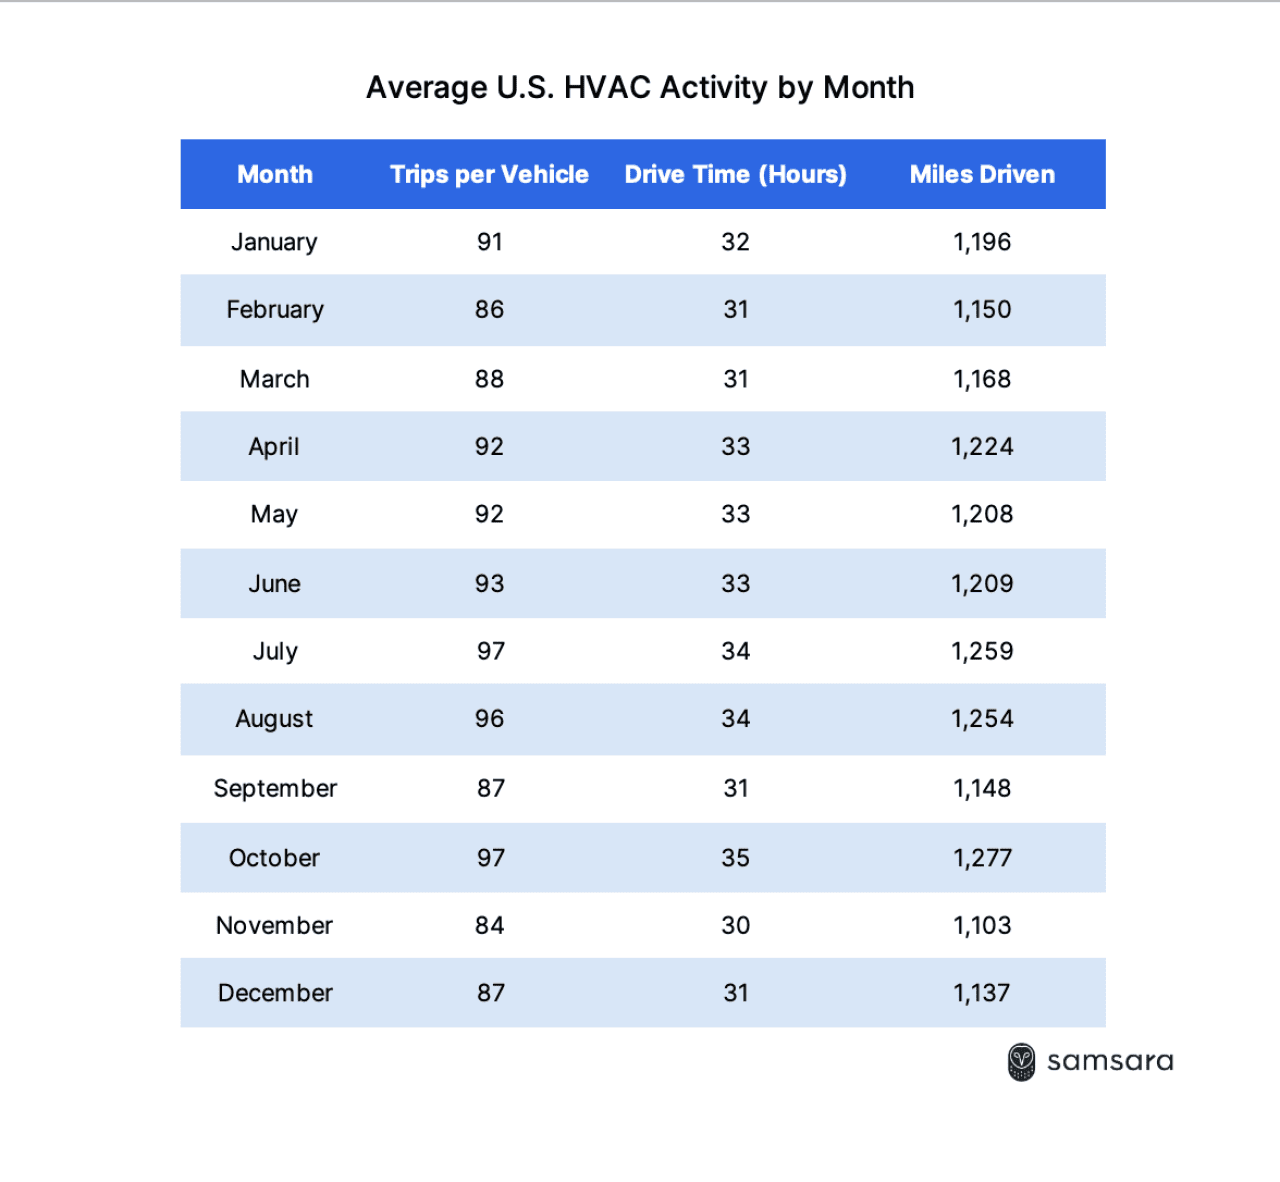
Samsara
February is the only month that is lowest across service visits, drive time, and miles driven. Once March begins, activity climbs steadily and remains elevated for most of the year.
Only 2 States See February Above Their Typical Workload
Comparing each state’s February activity to its own yearly average shows that the late-winter slowdown is widespread. Only Alaska and Hawai’i record February workloads above their normal monthly levels.
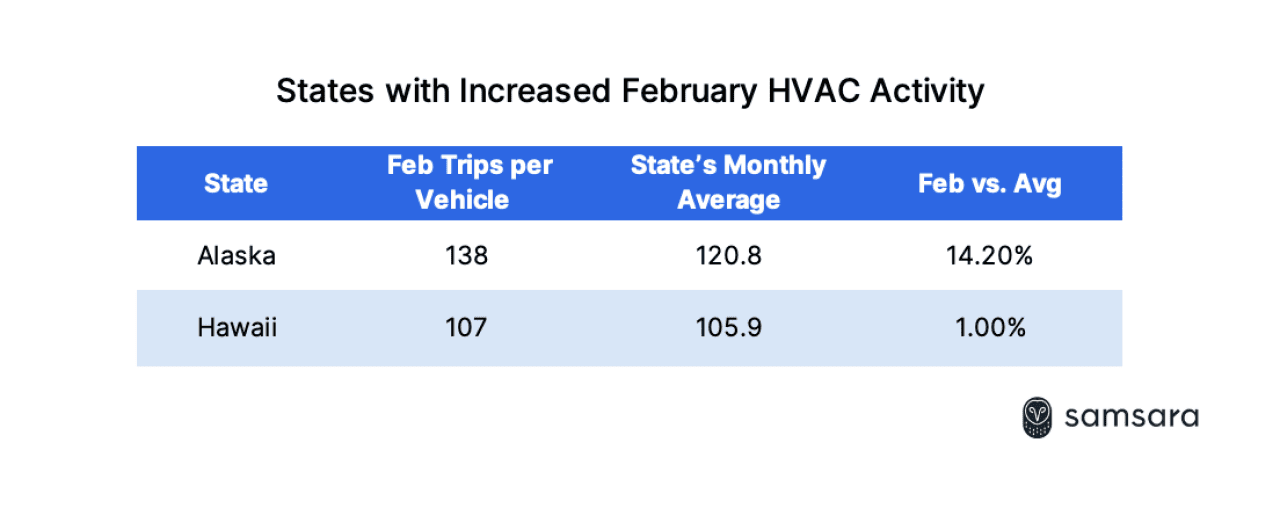
Samsara
Alaska’s increase reflects concentrated winter heating demand and long service distances, while Hawai’i’s small lift reflects steady, year-round usage. In the rest of the country, February activity sits at or slightly below typical levels—creating the only point in the year when demand eases nationally before rising again in spring.
Demand Begins Climbing Immediately After February
February is not just the slowest month—it is the inflection point before activity begins to rise again.
In the national data, HVAC technicians average 86 trips per vehicle in February, the lowest level of the year. That figure increases to 88 in March and 92 by April, marking the start of