
Rido // Shutterstock
Wondering about retirement? It looks surprisingly different depending on where you are in the U.S. The amount you need to save and the age you can actually retire can change a lot from one state to another. This is mainly because of factors like the local cost of living, which affects how far your money goes. State tax policies and your access to retirement benefits also play a huge role in shaping your financial future. Ultimately, where you live can have a big say in what your golden years look like.
Retirement expert John Stevenson analyzed how long it takes to save for retirement in each state.
John Stevenson
Key Findings
- 63% of Americans say high costs of living prevents them from saving more for retirement.
- 14% of Americans have withdrawn money from their retirement savings in the past 12 months to cover everyday living expenses.
- 20% of Baby Boomers don’t have any retirement savings.
- 25% of Americans are not confident in their understanding of retirement planning.
- 42% of women feel anxiety around retirement planning, compared to just 23% of men.
- 37% of people are cutting back on travel/vacations and dining out to save for retirement.
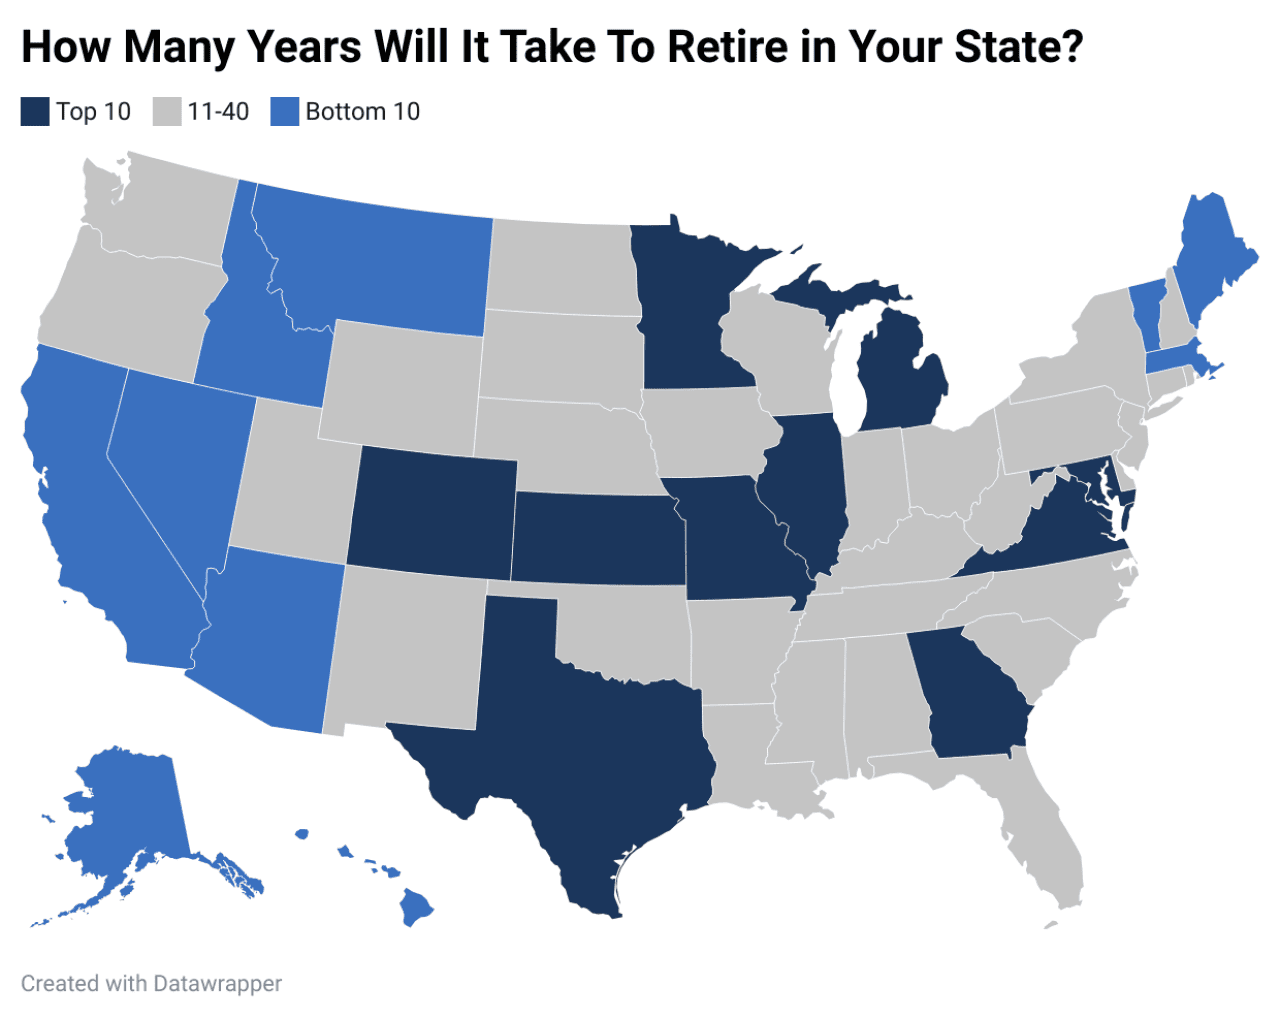
Top 10 Fastest States for Retirement
The best and worst states to retire were determined based on wage data and average annual expenses. Average wages were calculated using Bureau of Labor Statistics (BLS) data from May 2024.
Retirement goal amounts and average annual expenses were pulled from GOBankingRates. The number of years to retire was calculated by dividing retirement goal amounts by the difference between average wages and average expenses.
Illinois
Illinois offers retirees a winning combination of financial advantages and vibrant amenities. According to the analysis, the average resident needs $873,646 to comfortably retire. Given the state’s competitive wages and relatively low cost of living, it takes 26 years to retire.
Minnesota
Along with abundant natural beauty and outdoor opportunities, living in Minnesota offers significant benefits for retirees. With average annual wages of $68,880 and modest yearly expenses of $35,911, the typical Minnesota resident can expect to retire in 26 years.
Georgia
Georgia offers retirees a standout combination of financial comfort and affordability. Average annual expenses are relatively low at $34,180, and residents earn about $64,210 per year. In this welcoming fiscal environment, Georgia residents can be financially ready for retirement in 27 years.
Michigan
Tom Williams // CQ-Roll Call, Inc via Getty Images
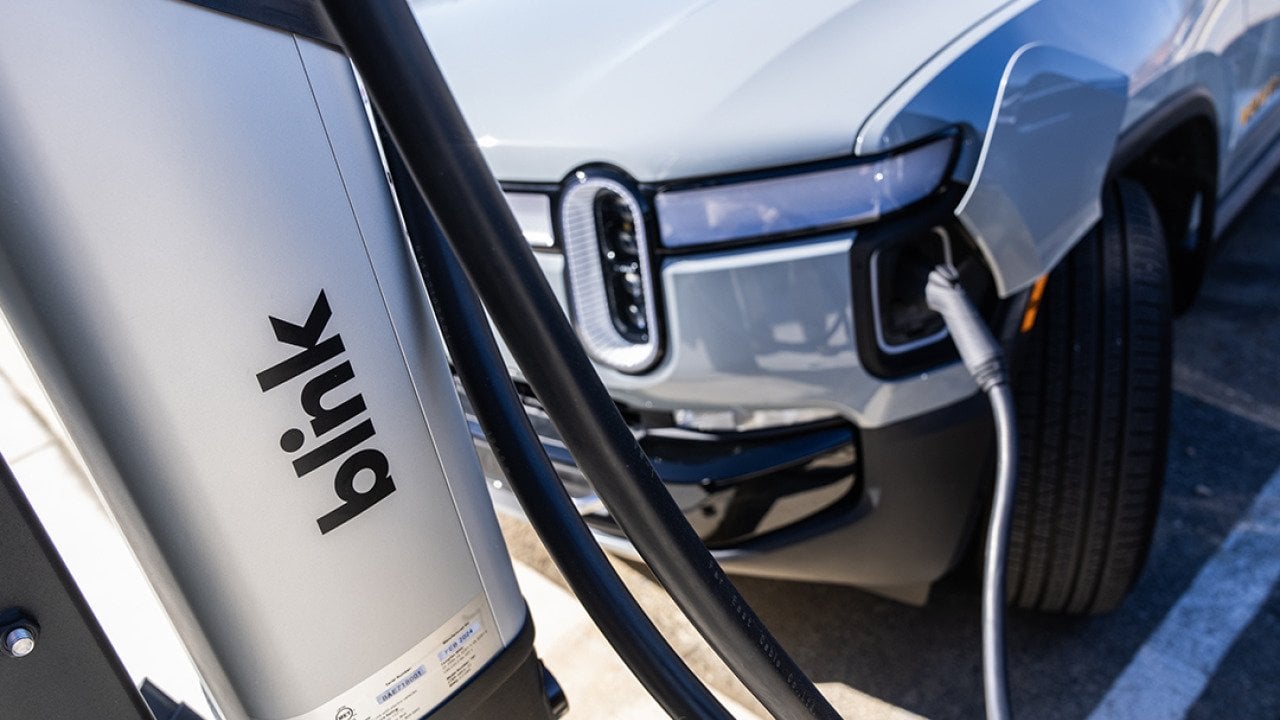
Electric vehicle sales have cratered.
Across the country, dealers sold about 20 percent fewer used electric cars in October than in September and saw a staggering 50 percent drop for new ones, according to the latest data. No one was surprised. Congress voted in July to end the federal tax credits that helped consumers afford them on Sept. 30, years before they were supposed to expire. That led to a rush of purchases before the deadline and a precipitous drop afterward.
The question now is whether this dip is a sign of a prolonged slump or a mere blip in an otherwise upward trajectory. While only time will tell, many analysts believe that electric vehicle adoption in the United States will continue to grow — albeit maybe not at the same pace seen before Congress killed the credits and automakers started second-guessing themselves.
“We’re definitely gonna see a slowdown,” Stephanie Valdez Streaty, director of industry insights at Cox Automotive, told Grist. Eliminating the federal credit of $7,500 on new EVs and $4,500 on used ones is certainly taking a toll. But the price of batteries, and thus cars, also continues to come down. Used models are becoming more of a bargain, too. As of this fall, the price gap between used EVs and their gas-powered equivalents had narrowed to just $900. In China, Valdez Streaty said, electric versions of cars often already cost less than their conventional counterparts.
“It’s not going to just stop,” she said of momentum in the United States. “It’s going to be gradual adoption, but I still think we’re going forward.”
Even with the decline, EVs are on pace for record sales this year and make up around 8 percent of the overall market. That is up from around 2.3 percent five years ago and a meager 0.66 percent a decade back. Valdez Streaty expects this trend to continue, as does Liz Najman, director of market insights at Recurrent, a company that provides data about EVs. She said that there are a slew of new, more affordable models, including revamped versions of the Nissan Leaf and Chevrolet Bolt, coming to market over the next year that should help drive demand.
By the end of 2026, there will be around 16 electric models available for less than $42,000 new, compared to half that this year, Najman said. And, like Valdez Streaty, she points to continued downward pressure on used prices expanding adoption of the technology. Most notably, dealerships offered a glut of lease deals on EVs in recent years, and many of those cars are approaching the end of their terms and will soon hit used lots.
“There are a lot of options for people,” said Najam, who is optimistic about the industry’s prospects. Kathy Harris, with the environmental nonprofit Natural Resources Defense Council, notes that EV owners don’t need to buy gas, and they avoid some basic maintenance, like oil changes. That makes cars with cords more attractive. Overall, she said

Elen Nika // Shutterstock
CheapInsurance.com compiled statistics on gas prices in the U.S. using data from AAA. Gas prices are current as of December 29.
U.S. by the numbers
– Gas current price: $2.83
– Week change: -$0.03 (-1.1%)
– Year change: -$0.20 (-6.6%)
– Historical expensive gas price: $5.02 (6/14/22)
– Diesel current price: $3.55
– Week change: -$0.04 (-1.0%)
– Year change: +$0.05 (+1.4%)
– Historical expensive diesel price: $5.82 (6/19/22)
Metros with the least expensive gas
#1. Des Moines, IA: $2.08
#2. Casper, WY: $2.08
#3. Lawton, OK: $2.12
Read on to see which metros have the most expensive gas prices.

Daniel Avram // Shutterstock
#5. Napa, CA
– Regular gas price: $4.45 
jittawit21 // Shutterstock
#4. San Luis Obispo-Atascadero-Paso Robles, CA
– Regular gas price: $4.48 
Istvan Csak // Shutterstock
#3. San Diego, CA
– Regular gas price: $4.49 
Christian Mueller // Shutterstock
#2. Hilo, HI
– Regular gas price: $4.64 , HI")
Rangsarit Chaiyakun // Shutterstock
#1. Lihue (Kauai), HI
– Regular gas price: $4.97
This story was produced by CheapInsurance.com and reviewed and distributed by Stacker.

The post How gas prices have changed in the U.S. in the last week Dec. 29, 2025 appeared first on News Channel 3-12.